 Wi-Fi Analyzer & Heatmap · macOS
Raven
See the air around you. Import a floor plan, walk your space, and Raven maps coverage room by room in real feet — then scans every nearby network, shows the spectrum live, and tells you the clearest channel to use.

What Raven does
Everything you need to diagnose and plan a Wi-Fi network.
Live spectrum view
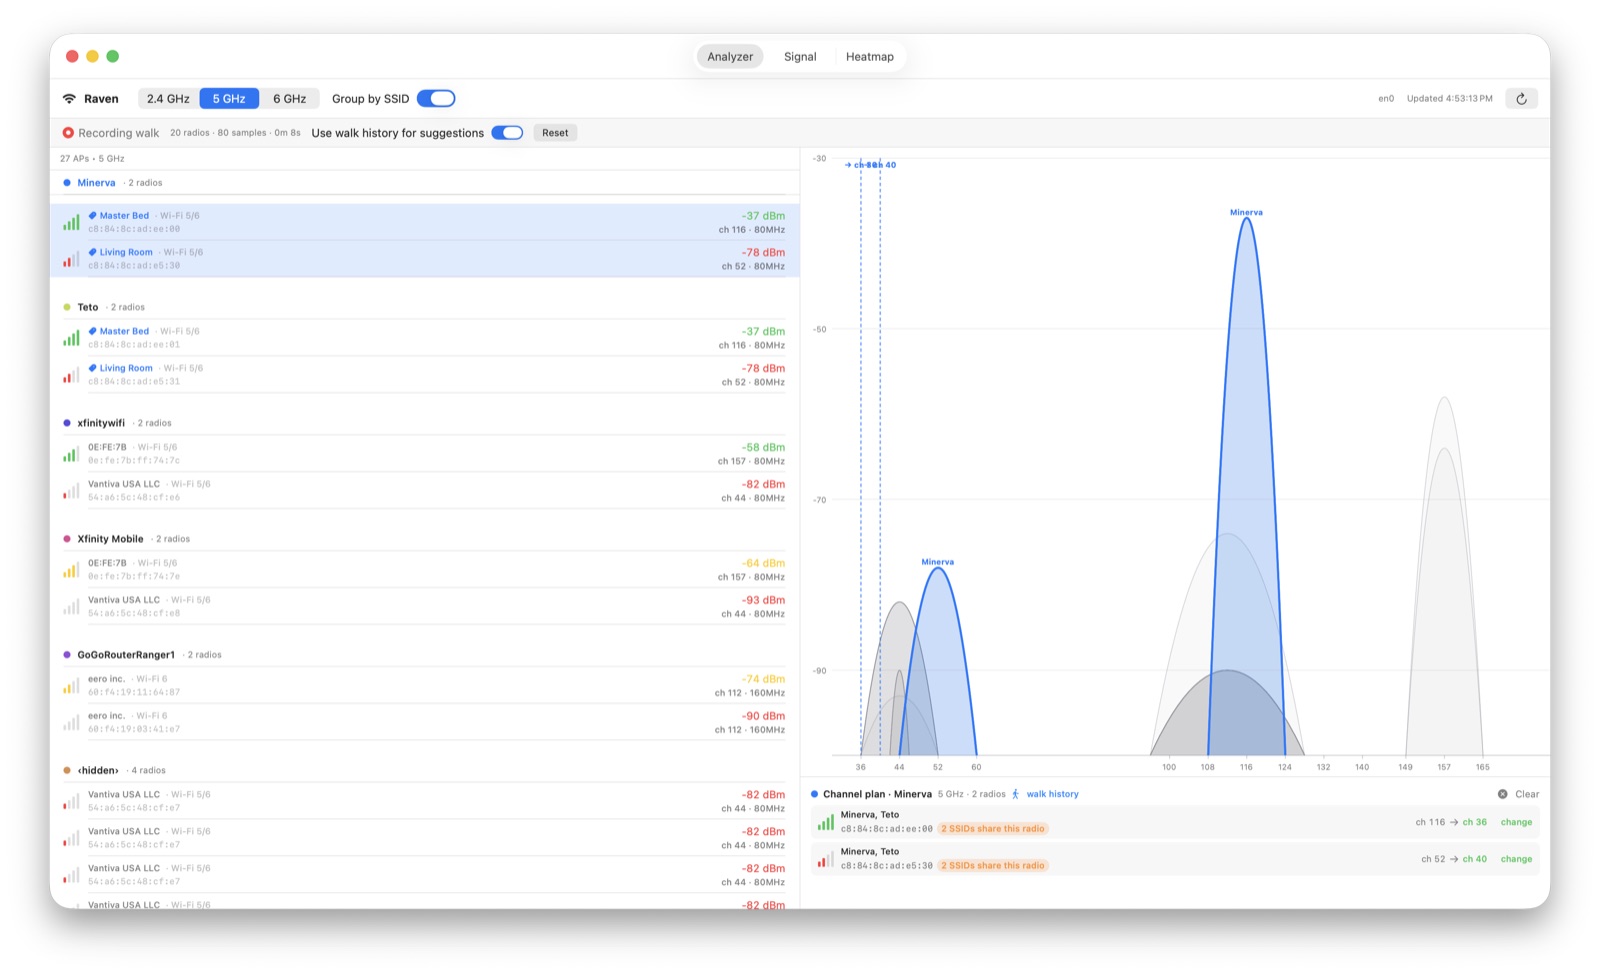
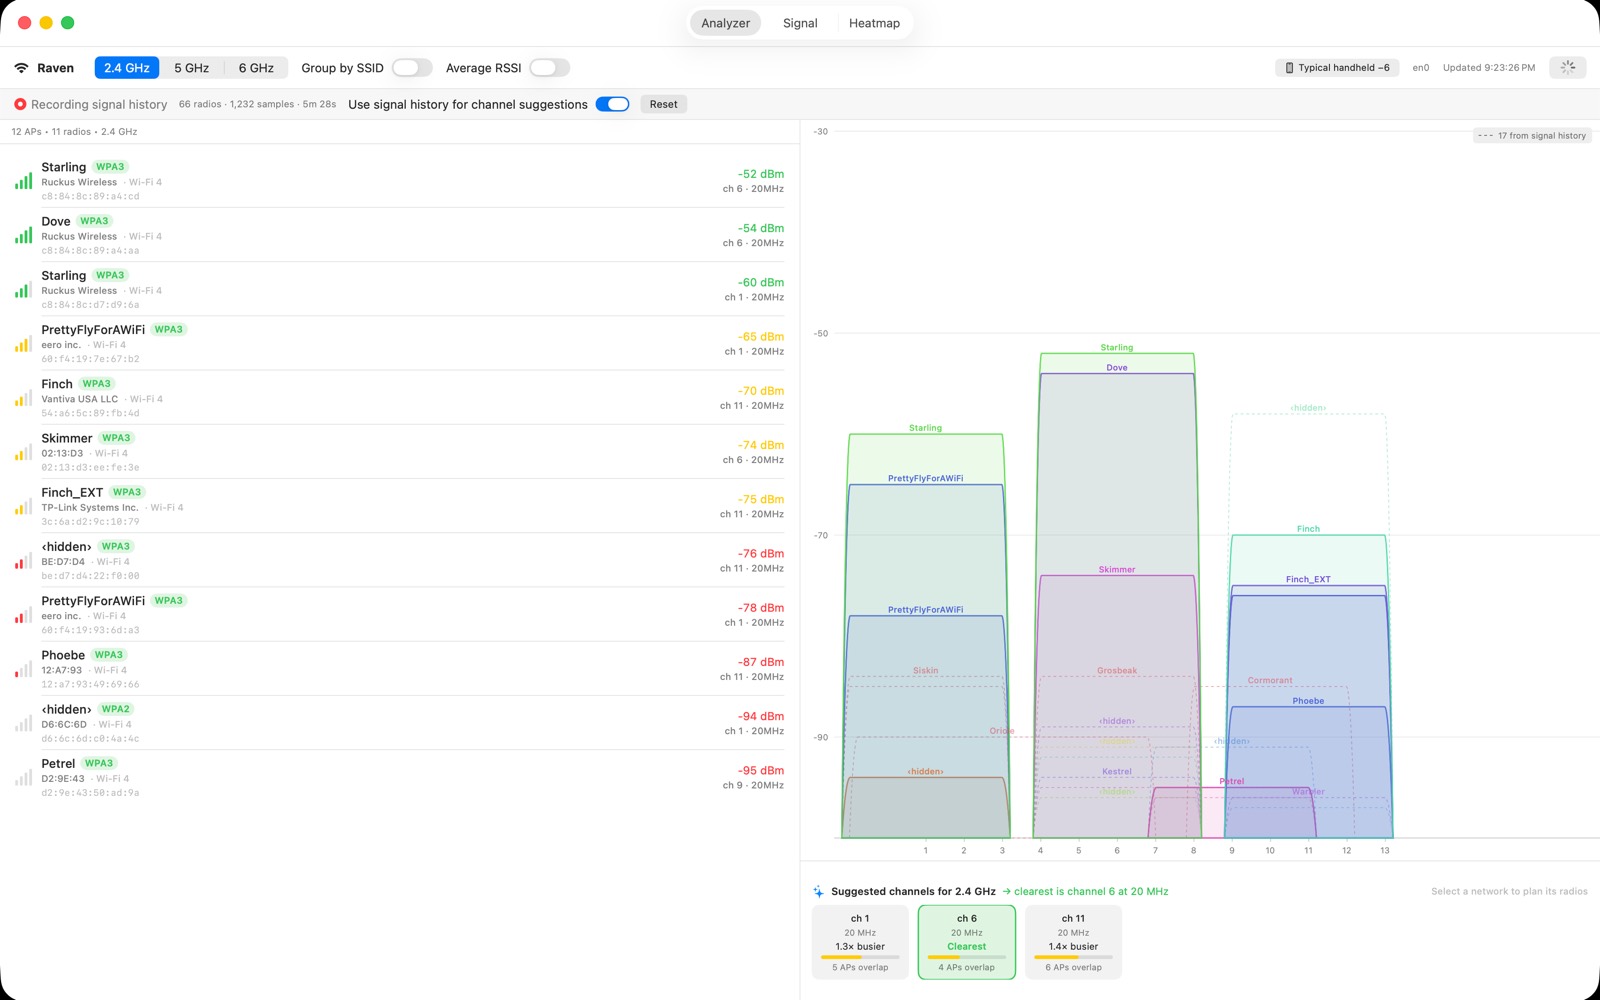
Watch every AP drawn across the frequencies it actually occupies on 2.4, 5, and 6 GHz — instantly see who's stepping on whom.
Smart channel advisor
A signal-weighted score ranks every channel and recommends the best one — counting co-located SSIDs on a radio only once.
Network detail
Per-network RSSI, channel, width, security (WPA3/WPA2/OWE), vendor, and approximate Wi-Fi generation — sorted by signal.
Coverage heatmaps
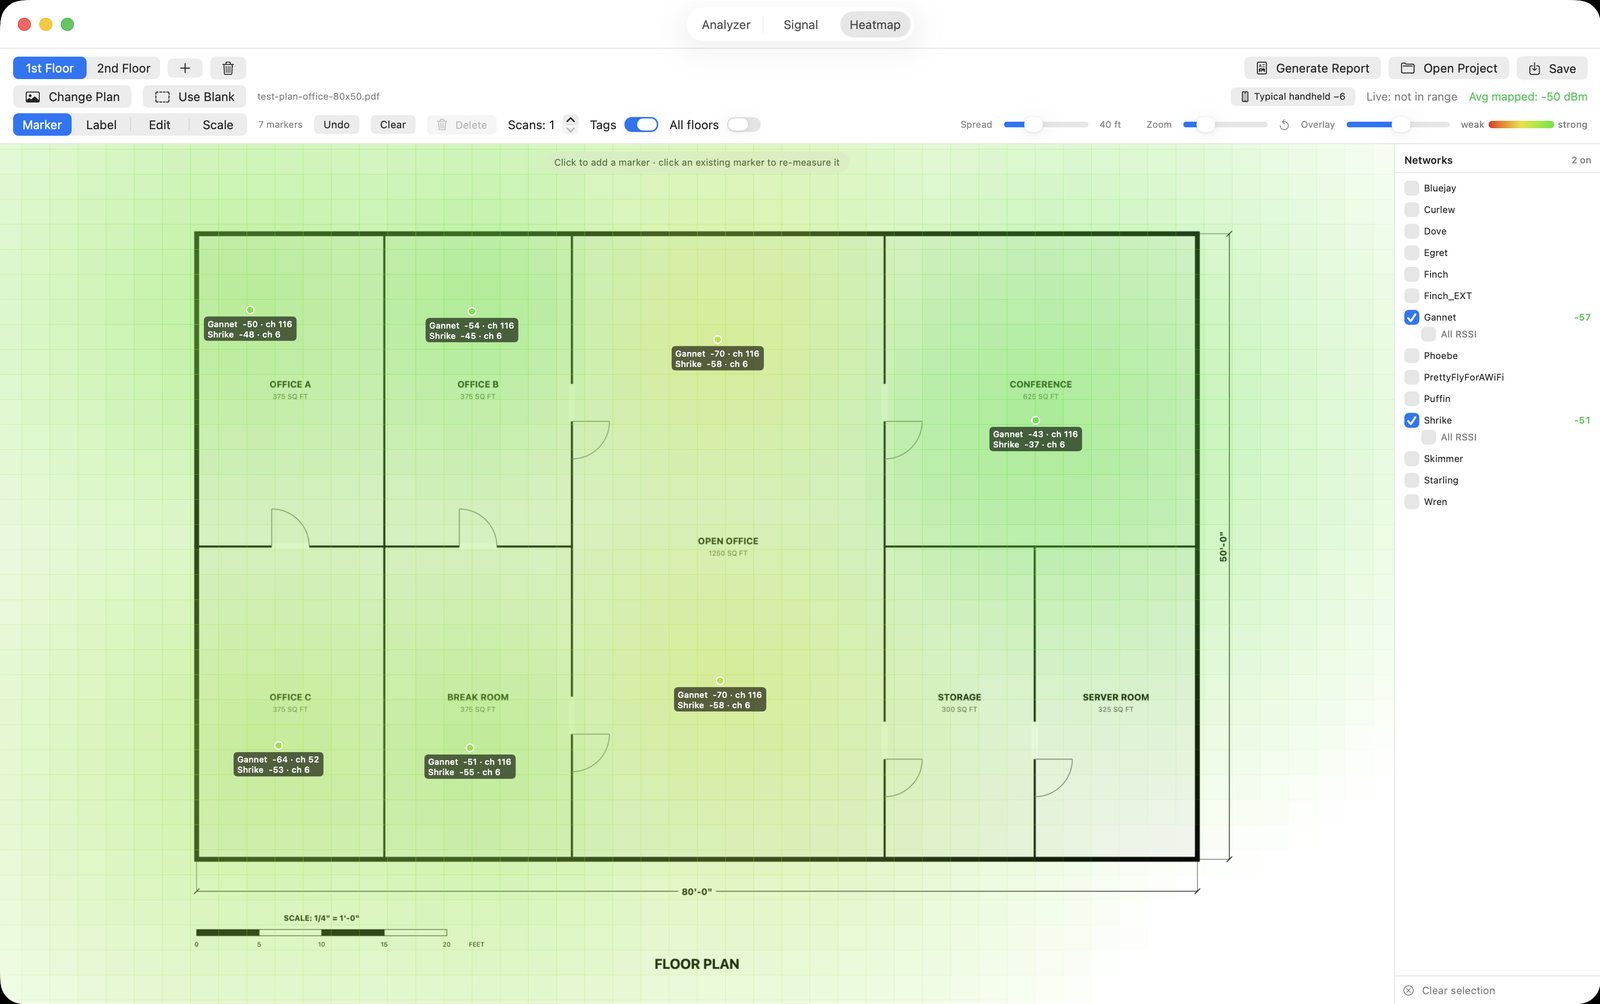
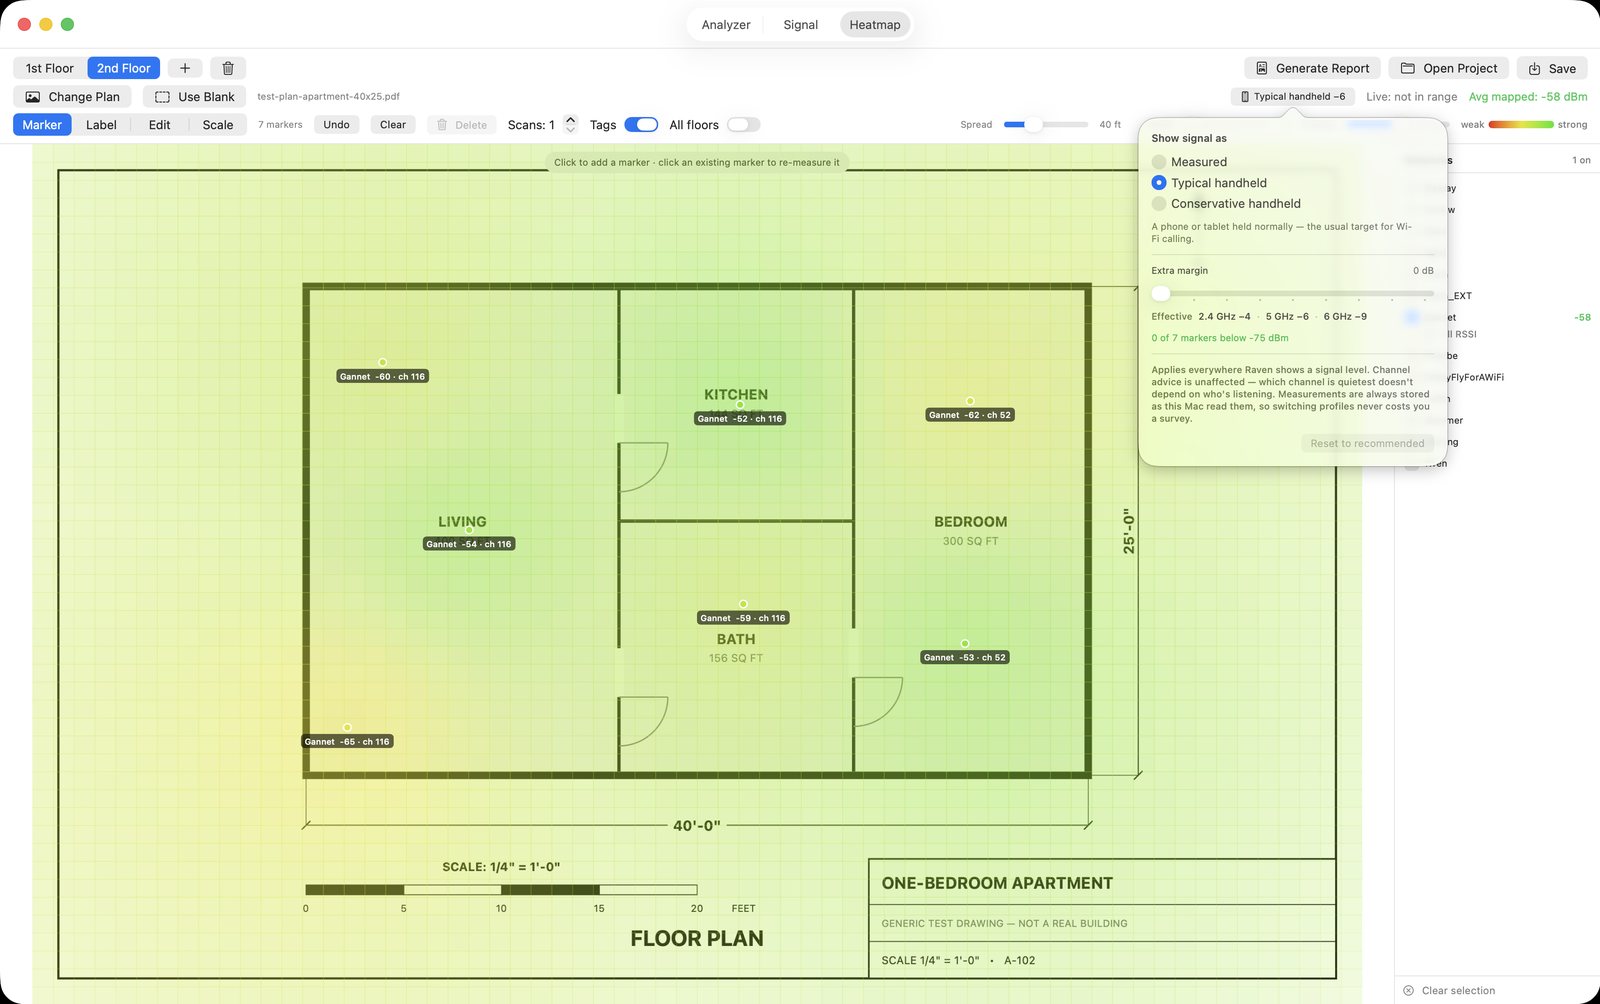
Import a floor plan (or use a blank canvas), walk your space, and Raven paints a signal heatmap — multi-floor supported.
Walk surveys & timeline
Record a walk to capture peak signal everywhere you go, and watch RSSI-over-time per radio to chase down drops and dead zones.
PDF site surveys
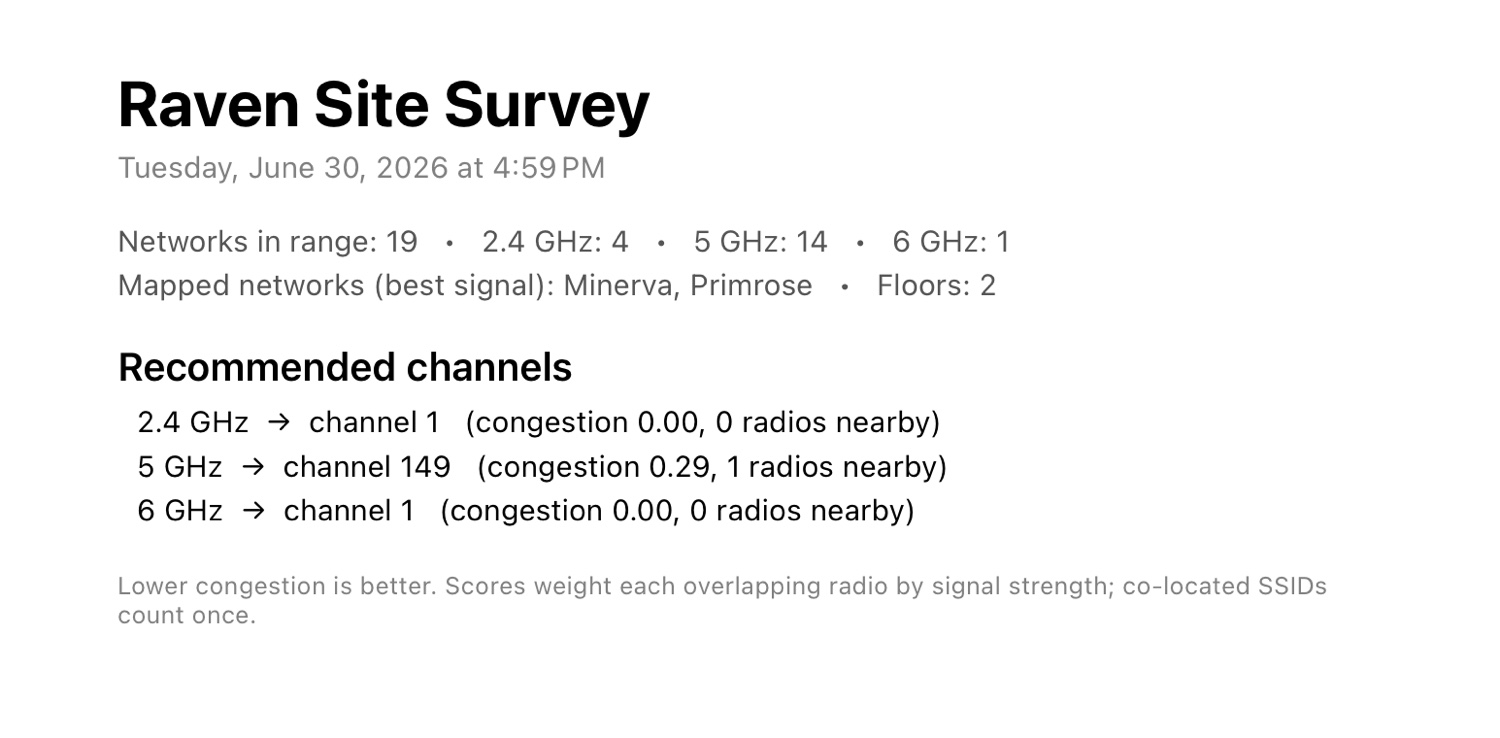
Export a multi-page report — a per-band channel plan listed in deployment order, composited heatmaps for every floor, and dead zones in square feet.
What's new
Map each band separately, import the whole plan set a job comes with, and trust that every marker is a fresh measurement.
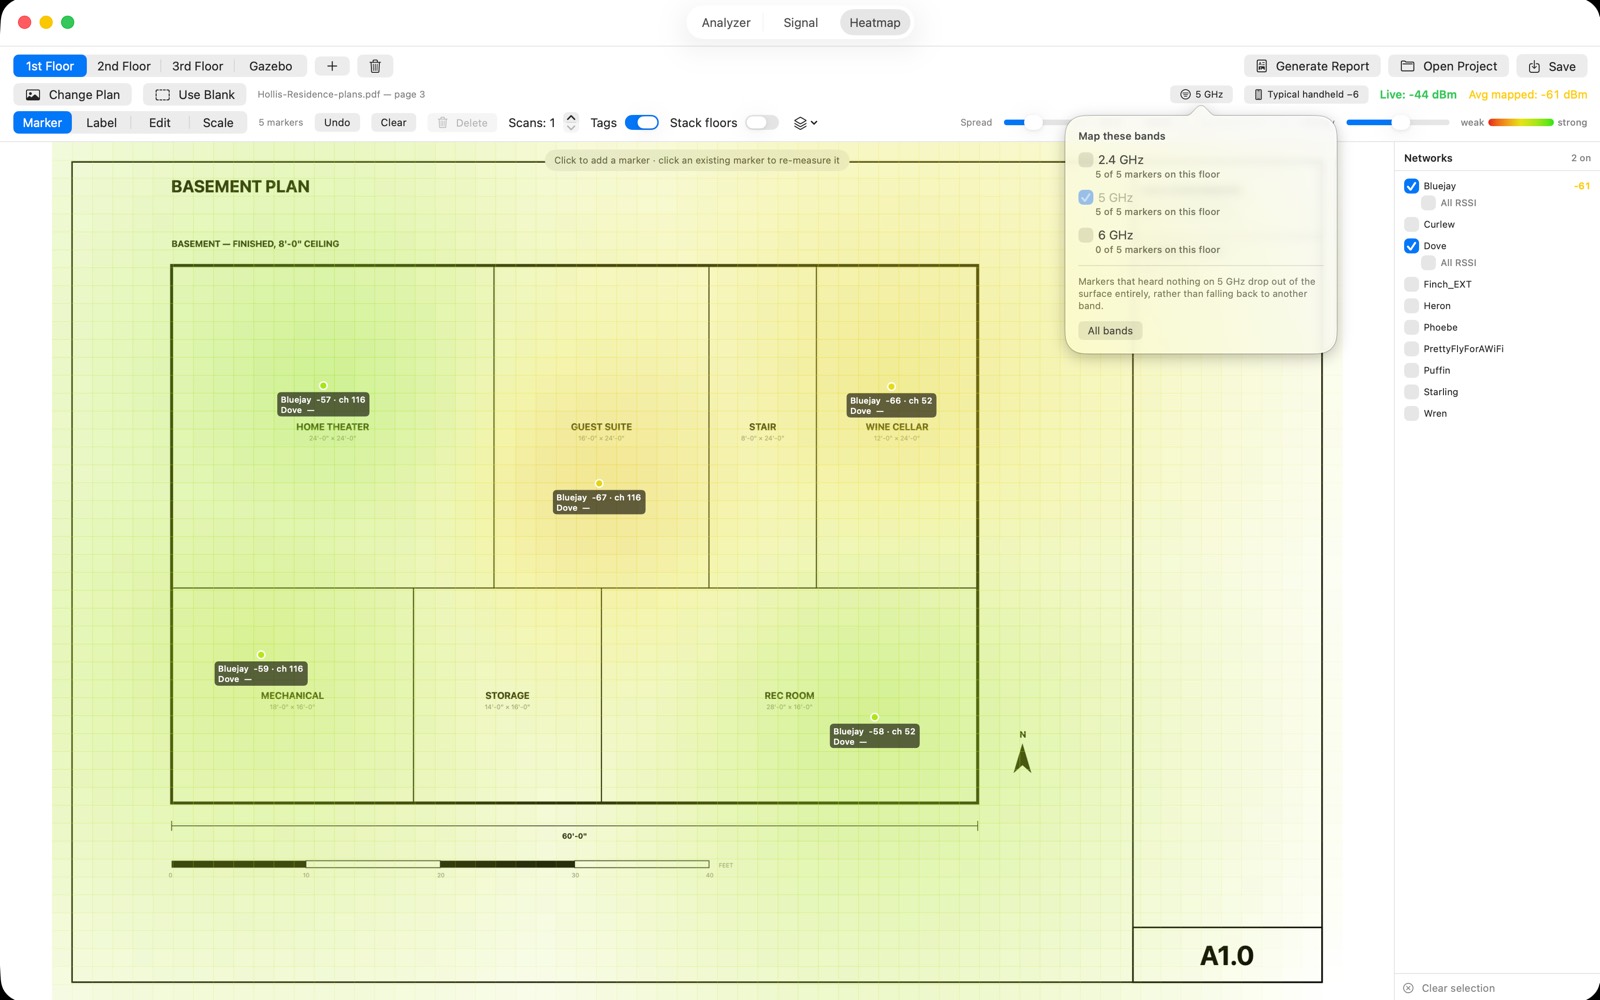
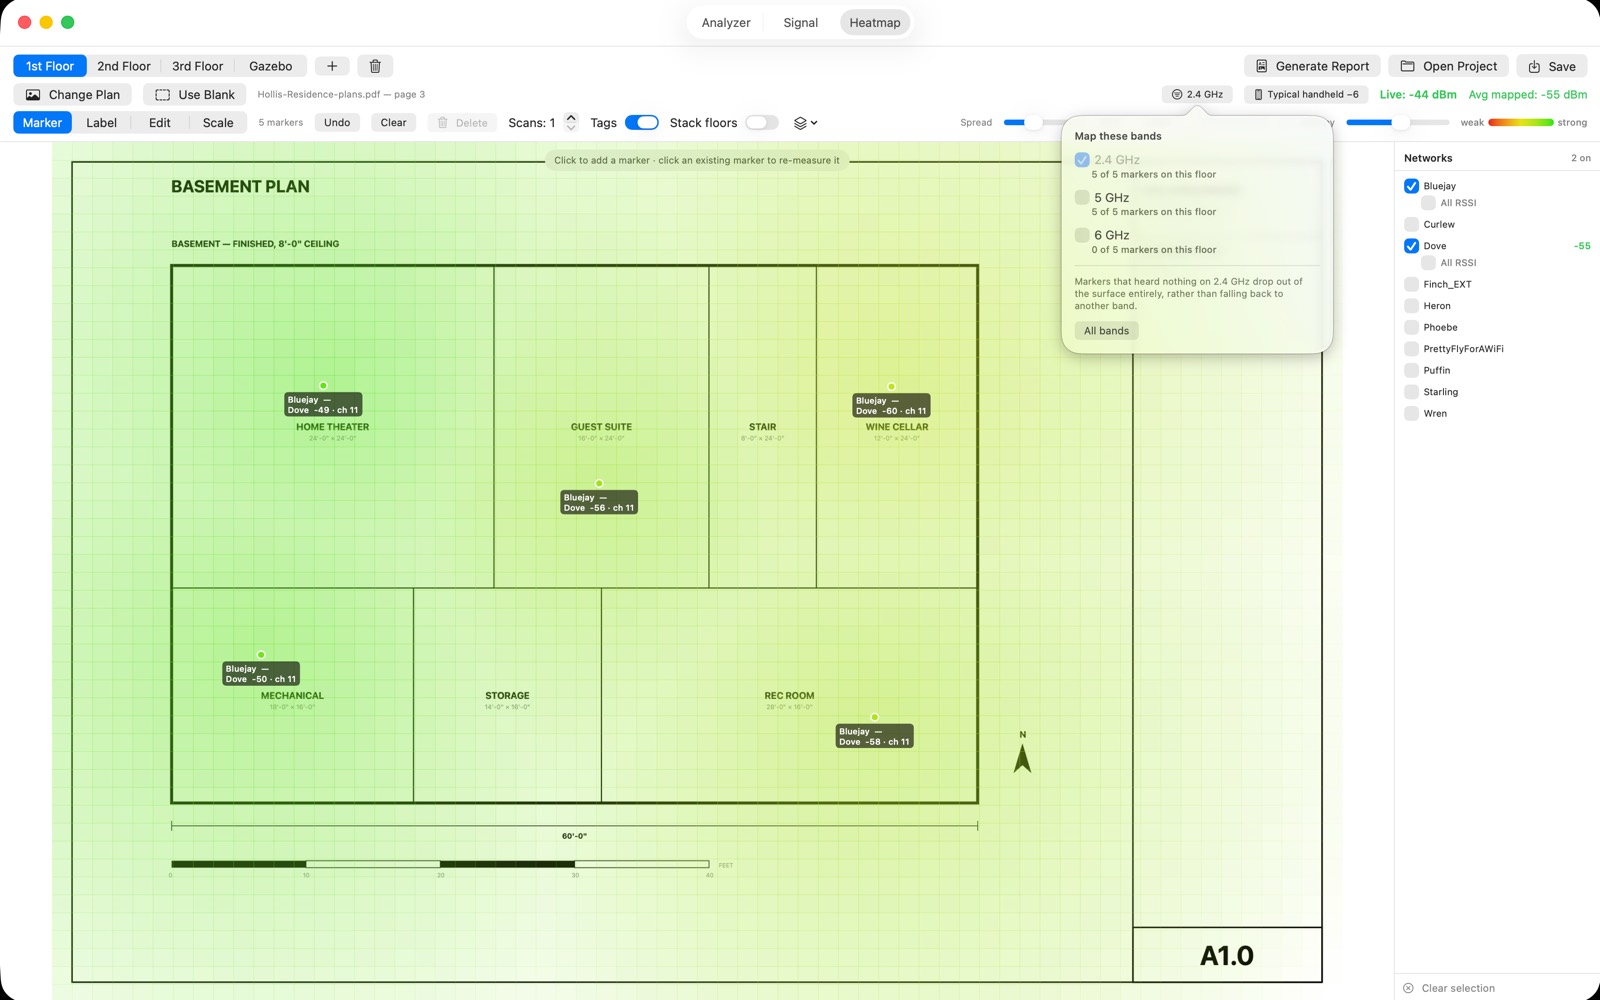
Map one band at a time
A network on both 2.4 and 5 GHz is one name in the list but two different coverage maps. Draw either one, or any combination. Every marker already recorded every radio it heard, so choosing a band re-reads a survey you have already walked.
Import the whole plan set
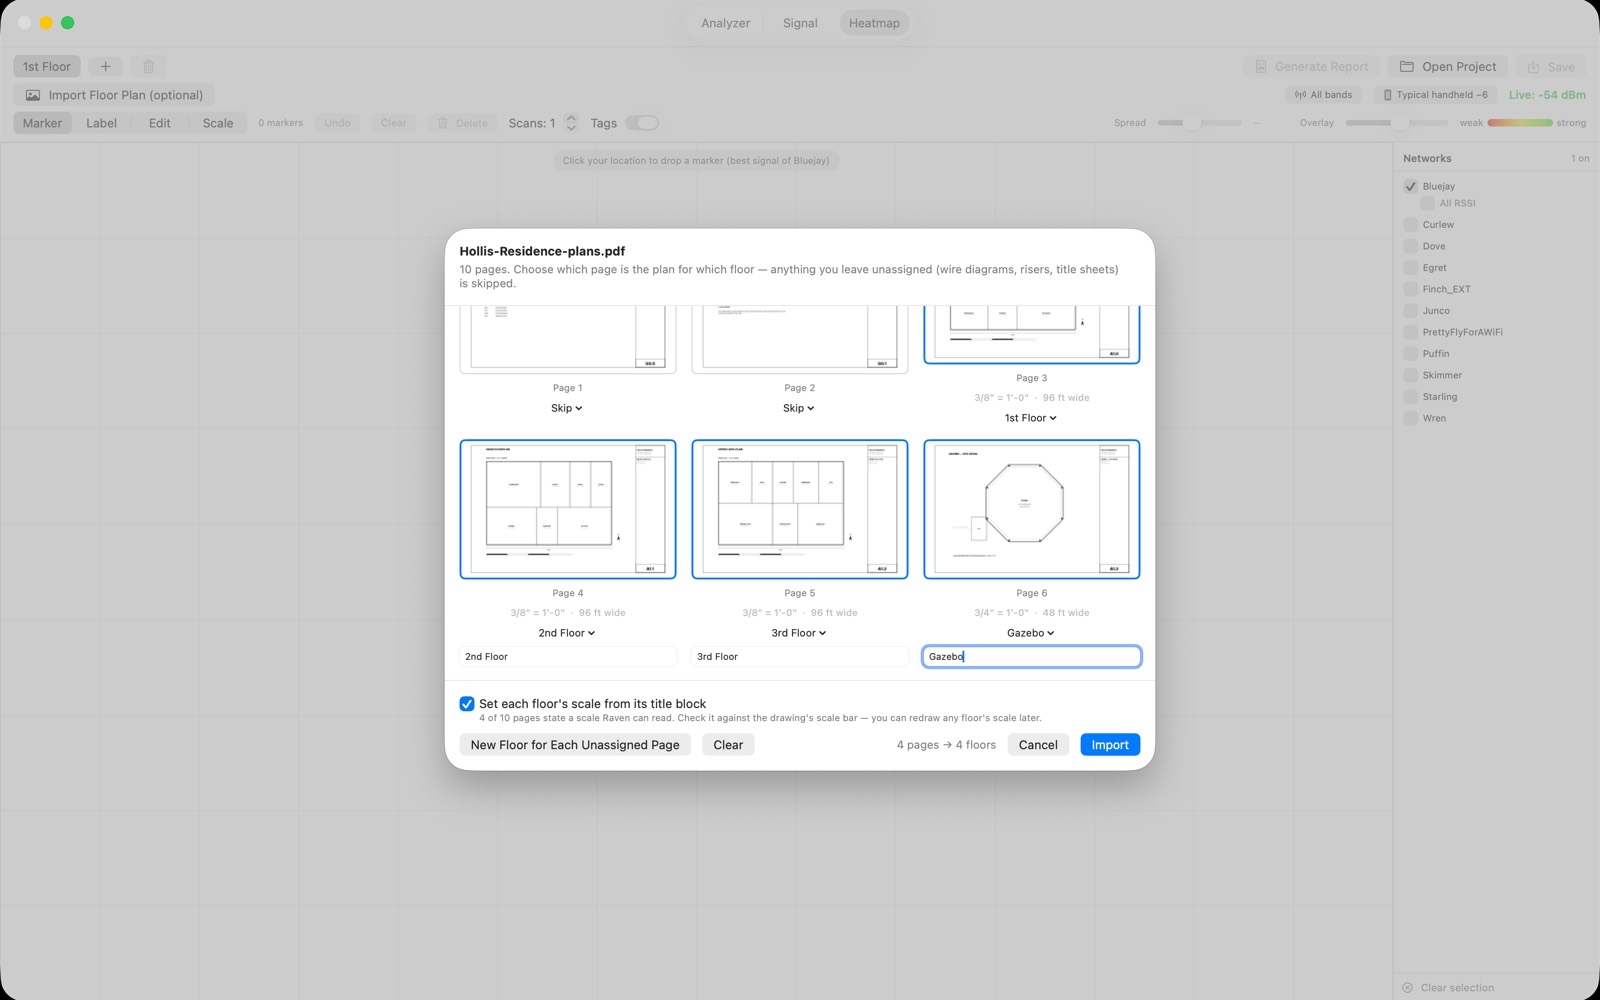
A job arrives as one PDF holding every level plus the risers and the scope of work. Raven opens it as pages — say which page is which floor and leave the rest unassigned.
Scale read from the drawing
Each sheet states its own scale in its title block. Raven reads it on import, so floors usually arrive already calibrated and every distance, area and coverage figure is real without measuring anything.
Congestion that counts you
The bar under each channel shows every radio heard on it. The coloured part is other people’s traffic — what the suggestion is based on — and the blue part is your own network. A channel your own access points sit on used to read as clear; now you can see the occupant is you.
Every network it heard, kept
Open a survey away from the building and the network list still shows what that survey recorded, listed apart from whatever is in range around you. A survey mapped against the wrong network can be pointed at the right one without walking it again.
Readings you can trust
macOS answers a Wi-Fi scan from a cache when asked again too soon, which could hand a marker the previous marker’s readings. Raven now recognises a cached answer and measures again instead of recording it.
A look inside
Real captures from Raven running on macOS.
$9.99 · one-time purchase, no subscription. Questions? theman@roaringman.com