Raven app icon Wi-Fi Analyzer & Heatmap · macOS

Raven

See the air around you. Import a floor plan, walk your space, and Raven maps coverage room by room in real feet — then scans every nearby network, shows the spectrum live, and tells you the clearest channel to use.

◆ macOS 14+ ◆ Apple Silicon native ◆ Built with SwiftUI

What Raven does

Everything you need to diagnose and plan a Wi-Fi network.

Live spectrum view

Watch every AP drawn across the frequencies it actually occupies on 2.4, 5, and 6 GHz — instantly see who's stepping on whom.

Smart channel advisor

A signal-weighted score ranks every channel and recommends the best one — counting co-located SSIDs on a radio only once.

Network detail

Per-network RSSI, channel, width, security (WPA3/WPA2/OWE), vendor, and approximate Wi-Fi generation — sorted by signal.

Coverage heatmaps

Import a floor plan (or use a blank canvas), walk your space, and Raven paints a signal heatmap — multi-floor supported.

Walk surveys & timeline

Record a walk to capture peak signal everywhere you go, and watch RSSI-over-time per radio to chase down drops and dead zones.

PDF site surveys

Export a multi-page report — a per-band channel plan listed in deployment order, composited heatmaps for every floor, and dead zones in square feet.

What's new

Map each band separately, import the whole plan set a job comes with, and trust that every marker is a fresh measurement.

Map one band at a time

A network on both 2.4 and 5 GHz is one name in the list but two different coverage maps. Draw either one, or any combination. Every marker already recorded every radio it heard, so choosing a band re-reads a survey you have already walked.

Import the whole plan set

A job arrives as one PDF holding every level plus the risers and the scope of work. Raven opens it as pages — say which page is which floor and leave the rest unassigned.

Scale read from the drawing

Each sheet states its own scale in its title block. Raven reads it on import, so floors usually arrive already calibrated and every distance, area and coverage figure is real without measuring anything.

Congestion that counts you

The bar under each channel shows every radio heard on it. The coloured part is other people’s traffic — what the suggestion is based on — and the blue part is your own network. A channel your own access points sit on used to read as clear; now you can see the occupant is you.

Every network it heard, kept

Open a survey away from the building and the network list still shows what that survey recorded, listed apart from whatever is in range around you. A survey mapped against the wrong network can be pointed at the right one without walking it again.

Readings you can trust

macOS answers a Wi-Fi scan from a cache when asked again too soon, which could hand a marker the previous marker’s readings. Raven now recognises a cached answer and measures again instead of recording it.

A look inside

Real captures from Raven running on macOS.
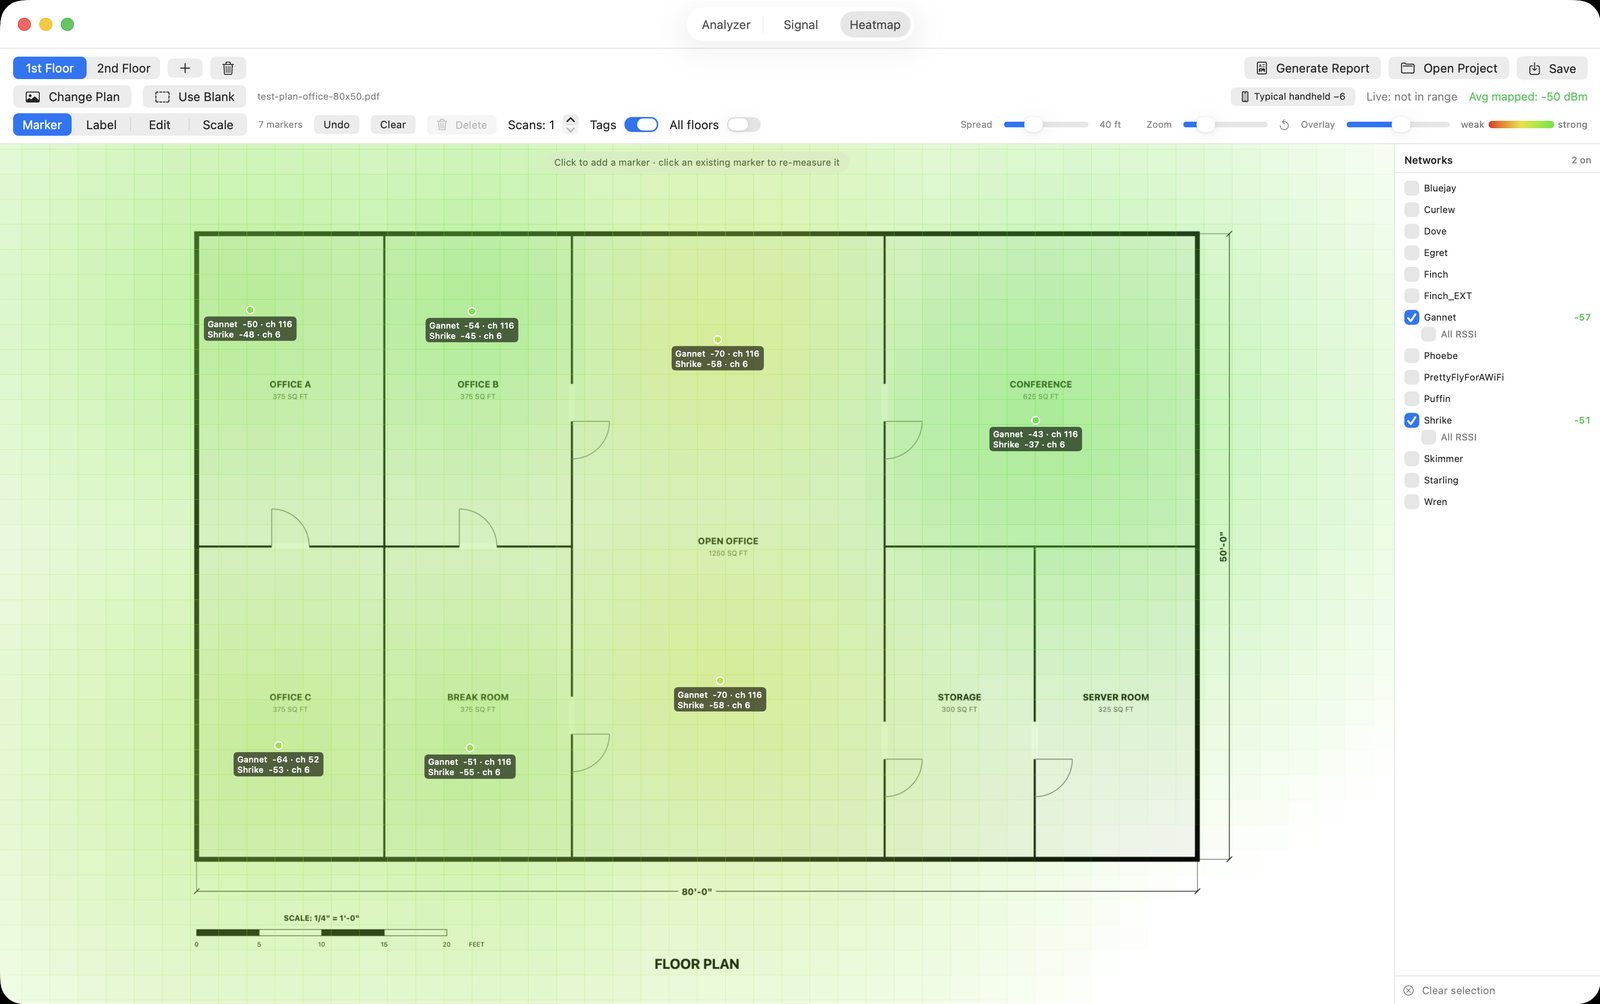
Raven coverage heatmap on a basement floor plan imported from a PDF drawing set, each marker labelled with two networks, their signal in dBm, and their channel
Coverage heatmap, with the numbers. Import a floor plan — a PDF blueprint works — and walk the space dropping a marker in each room. Raven paints live coverage and labels every spot with each network it heard, its signal, and its channel, reported for the client you're planning around.
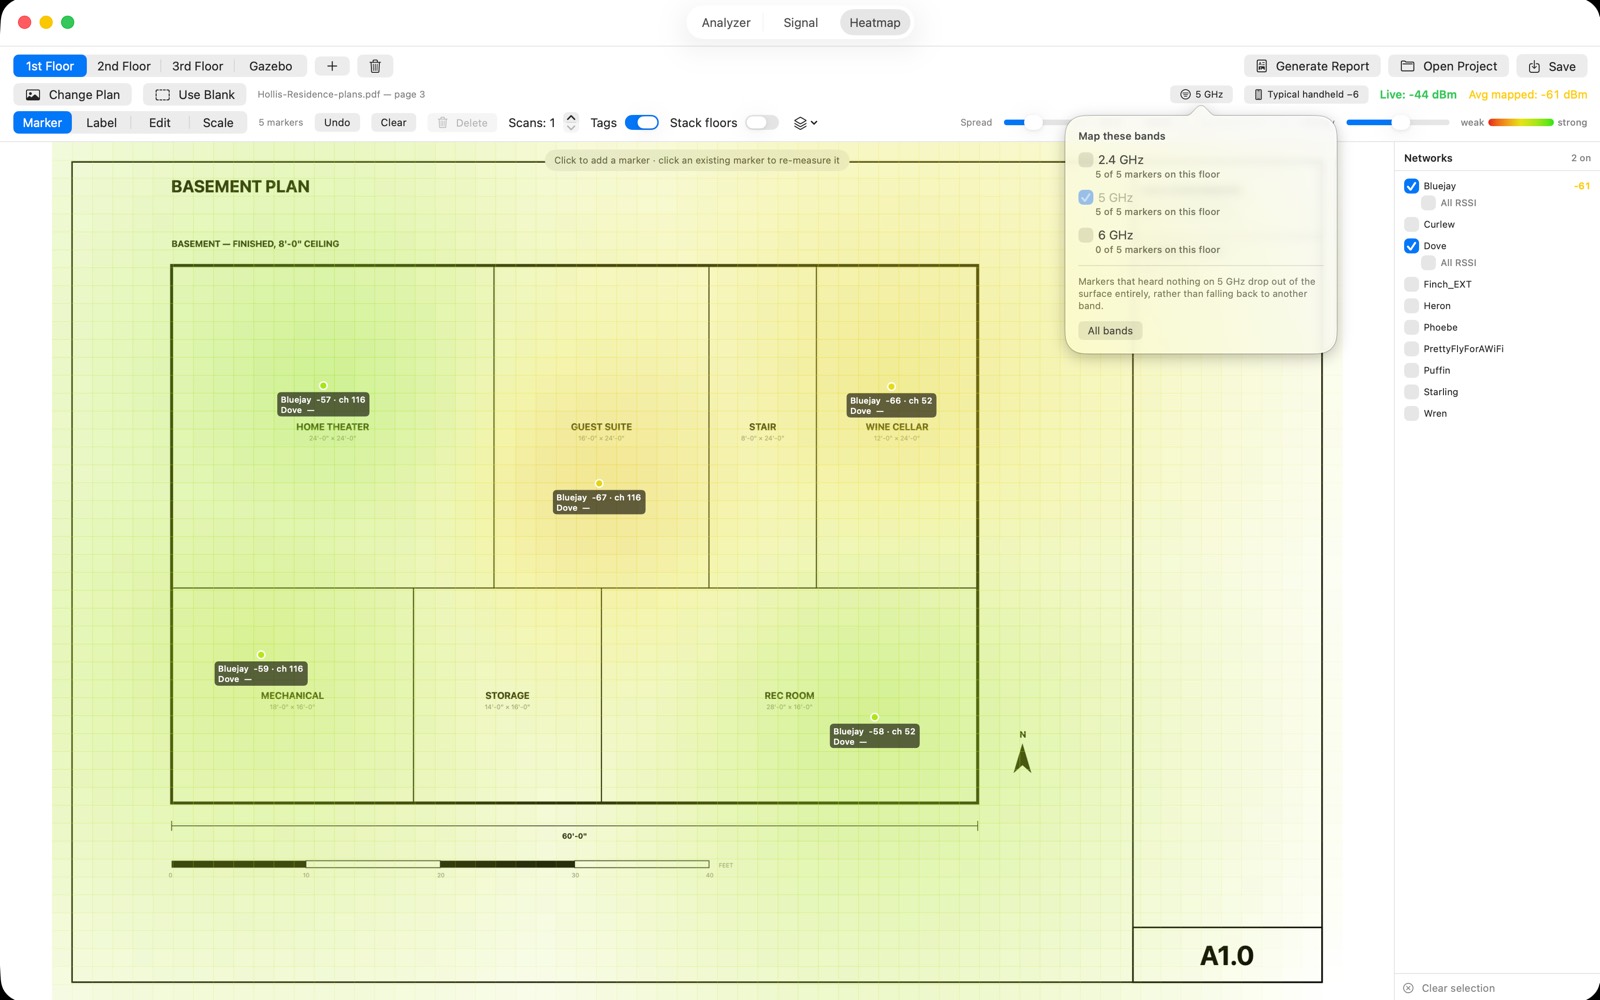
Raven basement heatmap drawn from 5 GHz only, with the band picker open showing 5 GHz selected and every marker counted on it
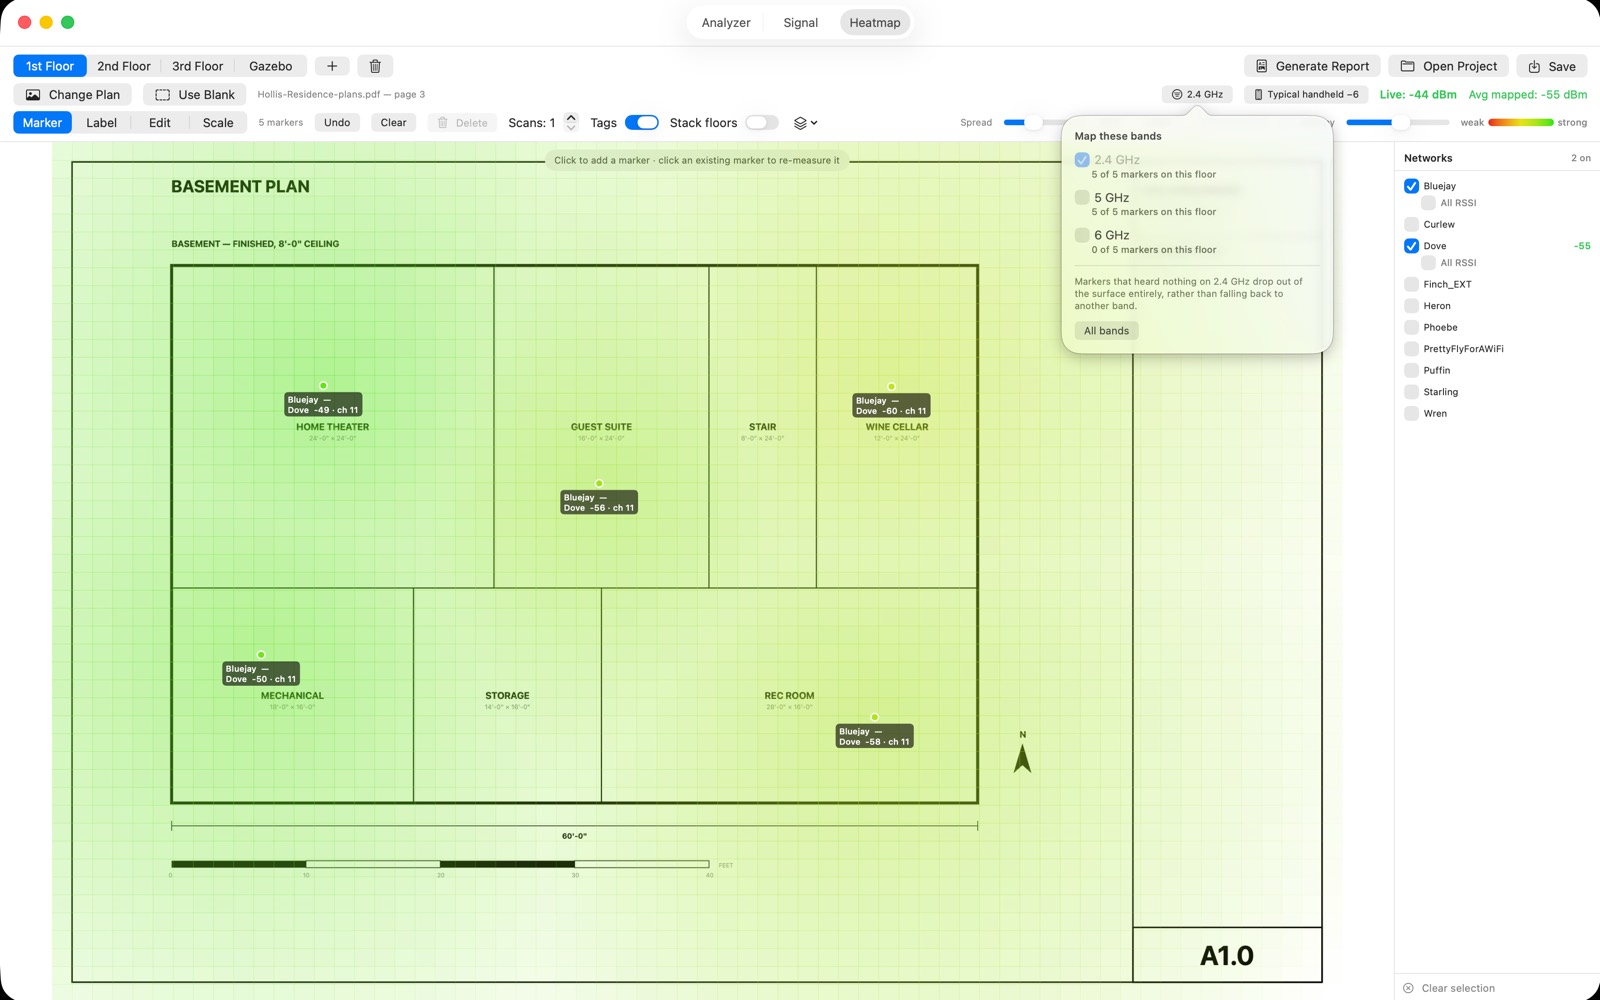
The same basement heatmap drawn from 2.4 GHz only, showing wider coverage than the 5 GHz map beside it
One survey, one band at a time. A network on both 2.4 and 5 GHz is one name in the list but two different coverage maps. Same five markers on both sides here — 5 GHz on the left averaging −61 dBm, 2.4 GHz on the right averaging −55. Every marker already recorded every radio it heard, so switching bands re-reads a survey you have already walked instead of sending you round the building again. Markers that heard nothing on the band you picked drop out of the map rather than quietly falling back to another one.
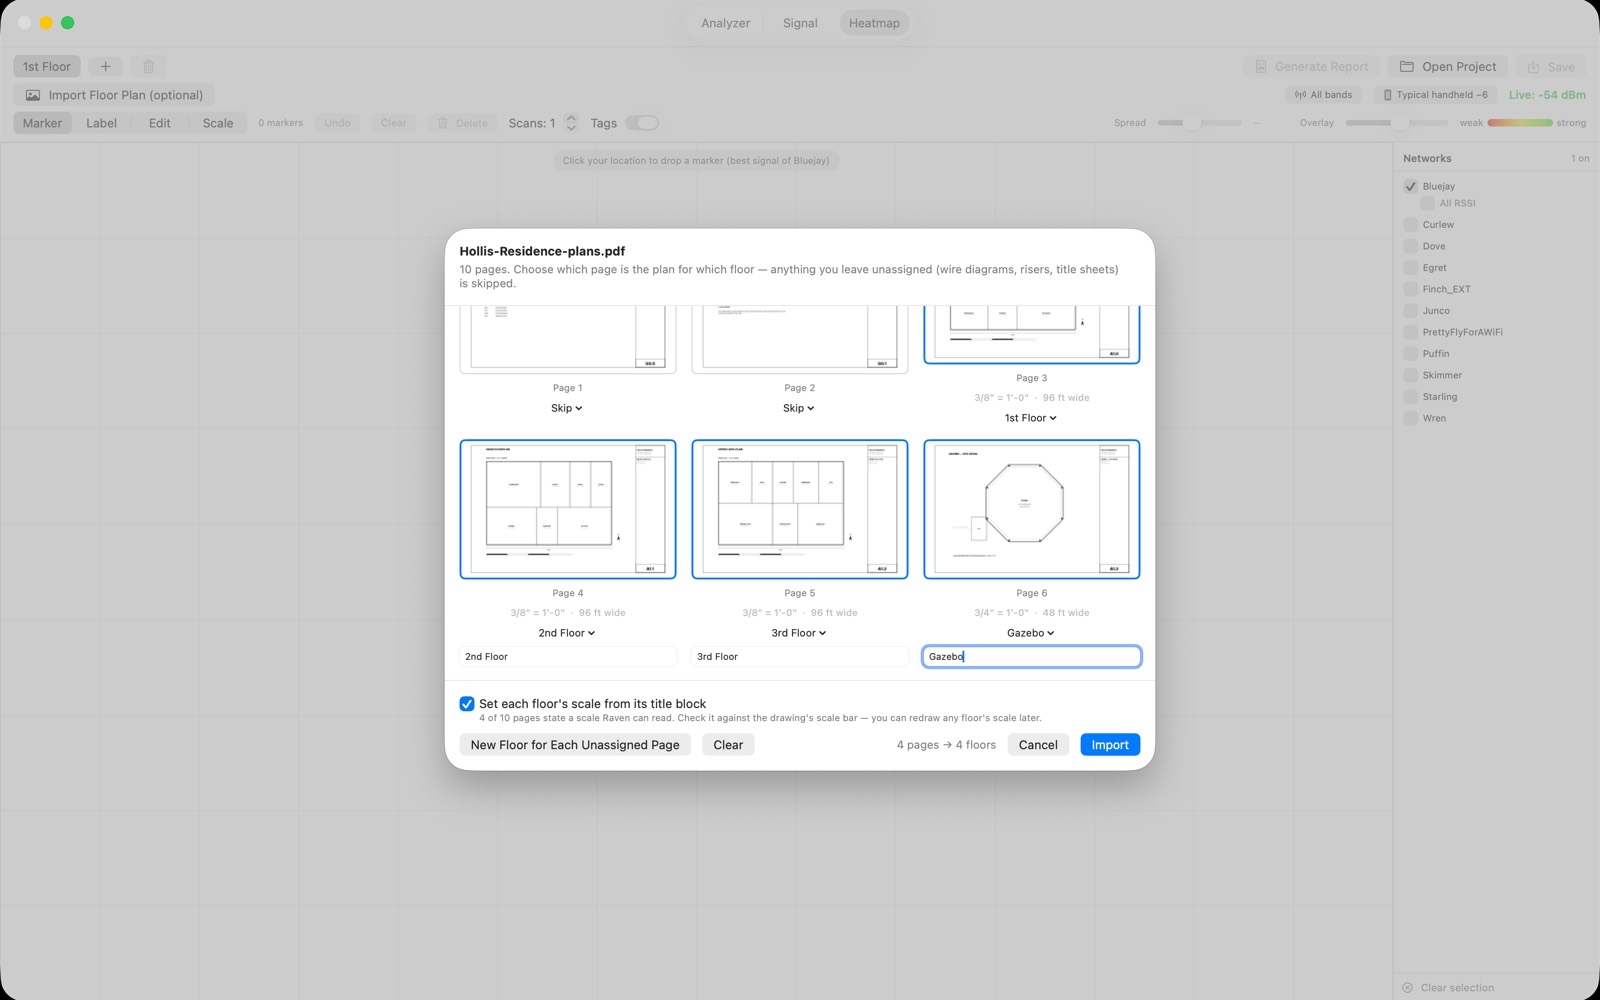
Raven page picker for a ten-sheet PDF plan set, each thumbnail captioned with the scale read from its title block and a menu assigning it to a floor
Hand it the whole plan set. A job arrives as one PDF holding every level plus the risers, the wire diagrams and the scope of work. Raven opens it as pages — you say which page is which floor and leave the rest unassigned. Each drawing’s scale is read from its own title block, so floors usually arrive already calibrated and every distance, area and coverage figure is real without measuring anything.
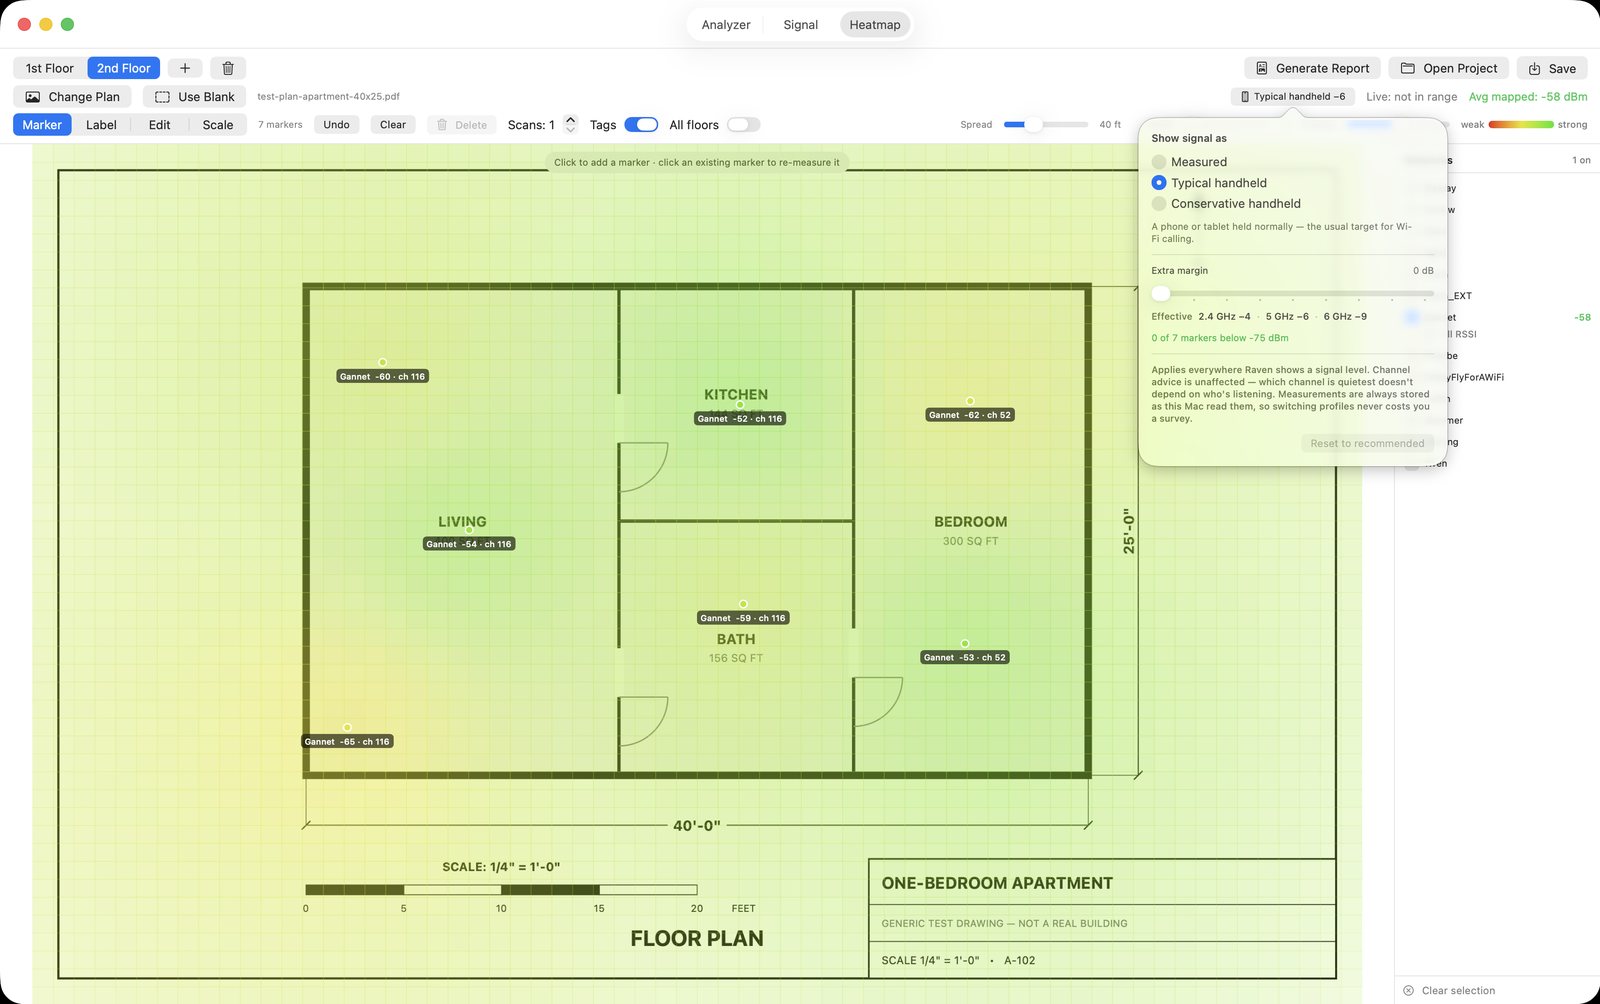
Raven main-floor heatmap with the client profile popover open, showing per-band offsets of 4 dB on 2.4 GHz, 6 on 5 GHz and 9 on 6 GHz
Survey for a phone, not your Mac. Pick the client you're planning for and every signal is shown the way that device would receive it — 4 dB off on 2.4 GHz, 6 on 5, 9 on 6, because the physics differs by band. Measurements stay as your Mac read them, so switching profiles redraws a finished survey instead of costing you another walk.
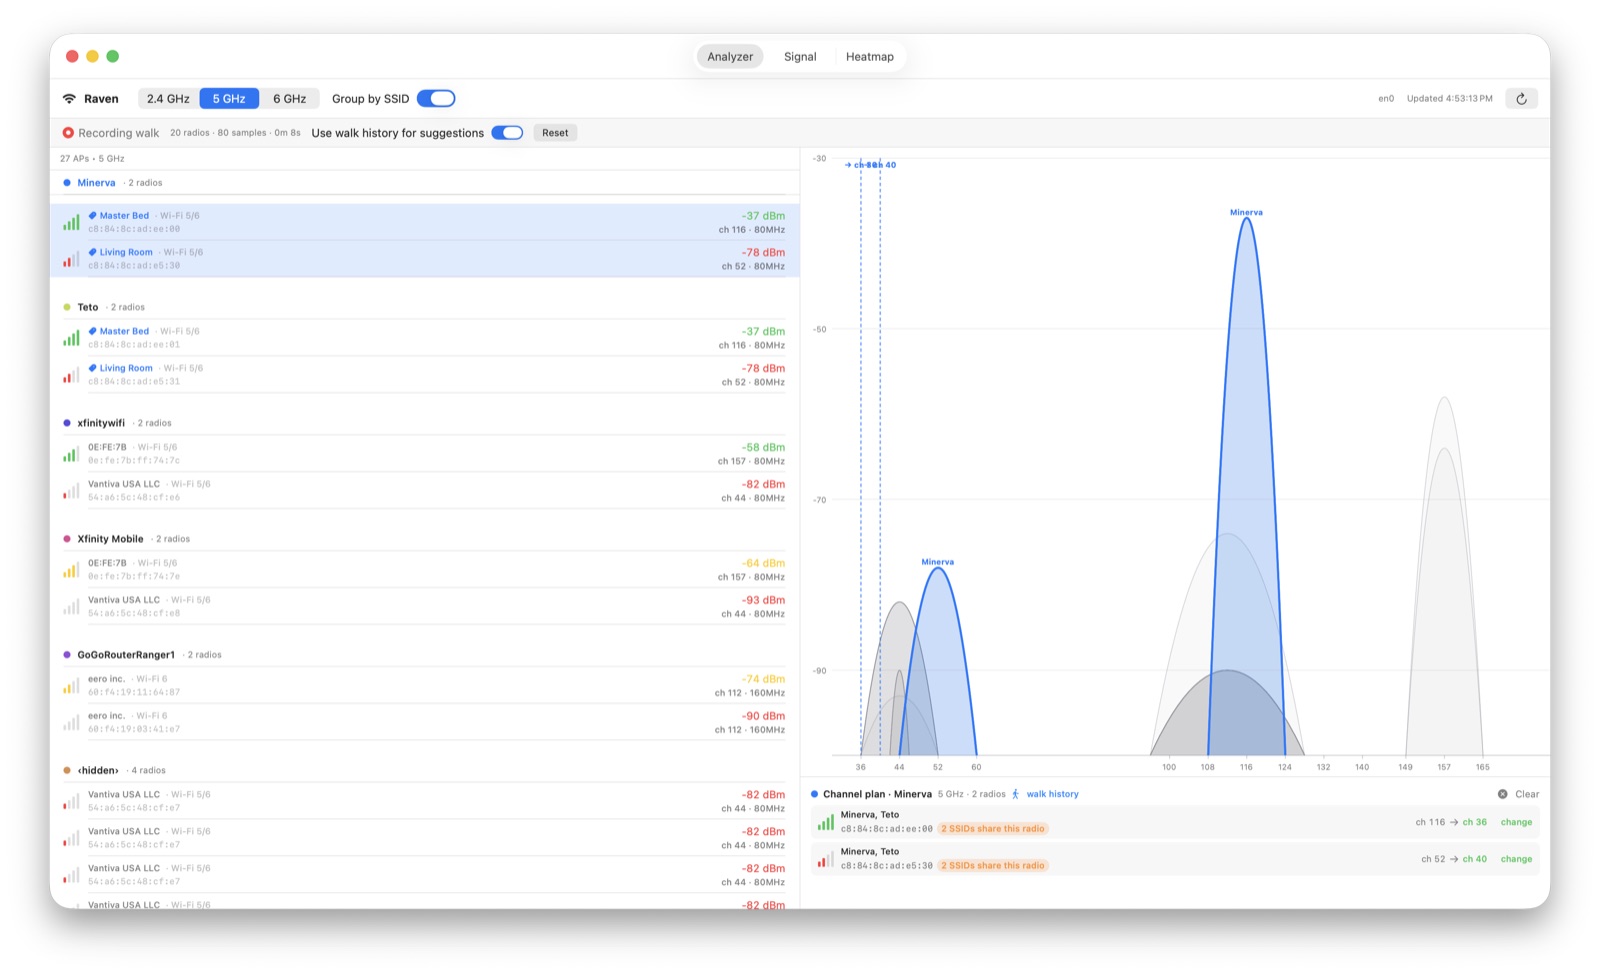
Raven 5 GHz analyzer with a network selected, showing a per-radio channel plan for its two 80 MHz radios, one marked with the eight neighbouring radios heard near it
A plan, not just a picture. Select a network and Raven lays out every one of its radios — what each is on now, how wide it is running, and where it should go. Record signal history first and each radio is planned against the neighbours heard near it, so an access point at one end of a building isn't moved for congestion it never sees. Name your own access points once and those names follow them across every band.
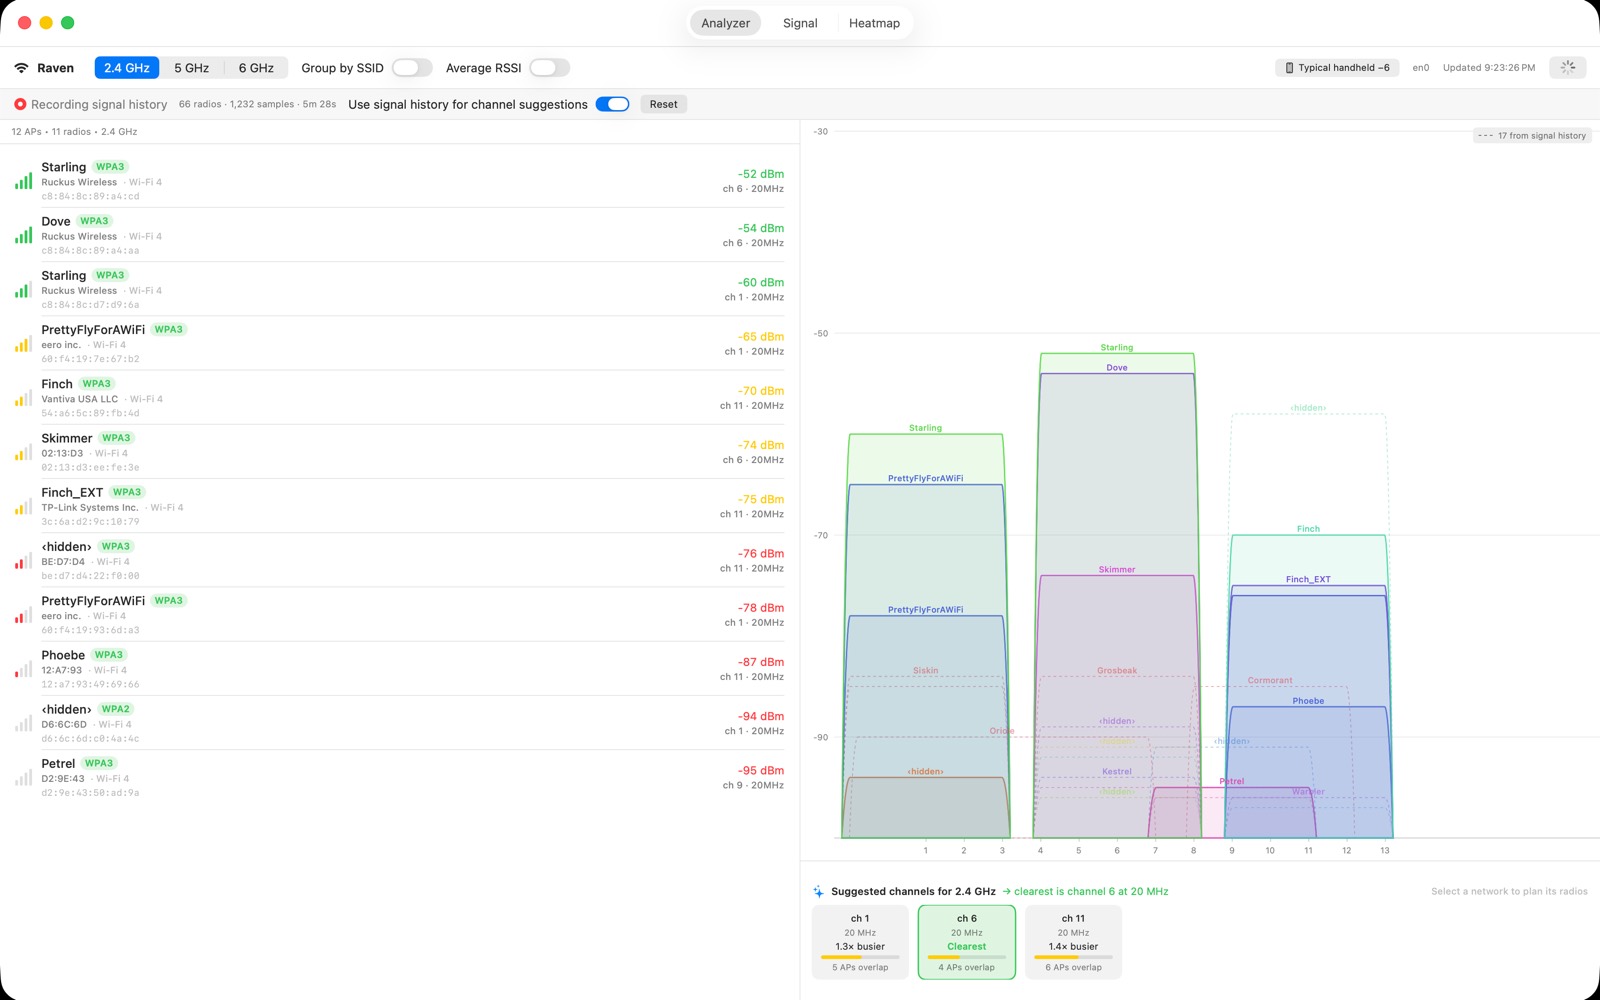
Raven 2.4 GHz analyzer showing suggested channels 1, 6 and 11 listed in channel order with channel 1 marked clearest and the other two about the same, and networks recorded elsewhere drawn as dashed outlines
See the congestion. On 2.4 GHz the pile-up is obvious at a glance, and the advisor scores every channel against it — weighted by how loud each neighbour is, and with your own access points left out, because your router is not a reason to move your router. Suggestions are listed in channel order so they line up with the graph above them, and networks Raven recorded elsewhere in the building are drawn as dashed outlines — they can't be heard from here, but they still count.
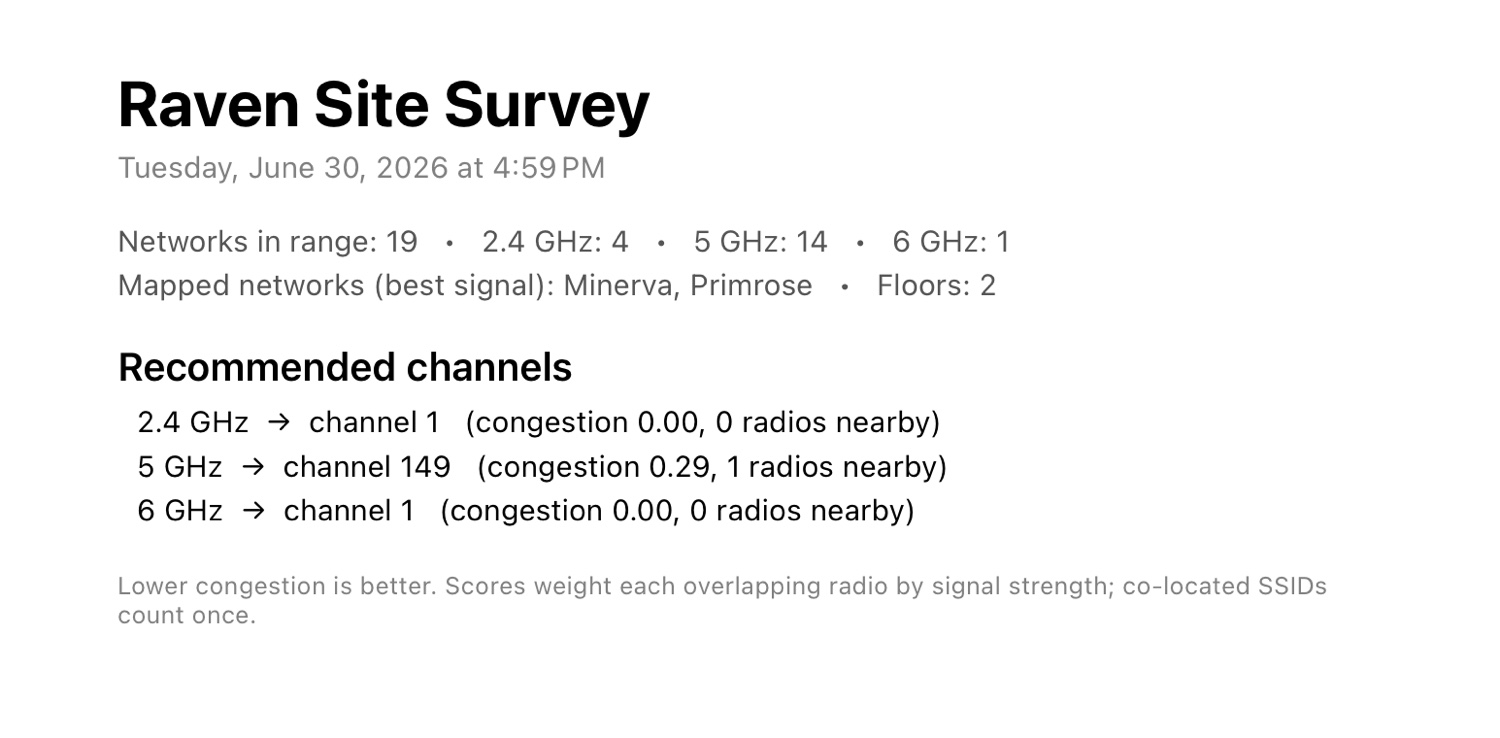
PDF · Site Survey Raven exported PDF site survey summary showing a per-band channel plan: how wide each band is running, how many channels it has, which need DFS, and the channels ranked in deployment order
Exportable site survey. One click turns your walk into a shareable PDF. Every band gets a plan followed by a coverage map for every floor. Good for a before and after, or just client reassurance that the job is done.
Download Raven on the Mac App Store

$9.99 · one-time purchase, no subscription. Questions? theman@roaringman.com